Reader Survey results 2022
This page provides a detailed breakdown of the results of our 2022 Reader Survey. To learn more about how we are responding to feedback and suggestions from library users, visit our 'You said, We did' page.
Response rate
We received 5,380 responses, of which 4,823 had sufficient answers to enable statistical analysis. All 2,034 free-text comments were analysed. The response level from current students was 28% higher than when the survey was run in 2019. 21% of undergraduates (2,768) and 13% of postgraduates (1,762) completed the survey. 52% of postgraduate responses were from Masters students and 47% from DPhil students. 181 responses were from academic staff (half the number in 2019) and 74 were from Bodleian Reader card holders (i.e. not current members of the University).
Overall satisfaction levels
| 2012 | 2016 | 2019 | 2022 | |
|---|---|---|---|---|
| In general, I am satisfied with the way I am treated by the libraries | 7.64 | 7.69 | 7.84 | 7.79 |
| In general, I am satisfied with the libraries' support for my learning, research and/or teaching needs | 7.32 | 7.36 | 7.47 | 7.40 |
| How would you rate the overall quality of the service provided by the libraries | 7.47 | 7.57 | 7.71 | 7.62 |
This is a slight drop on the 2019 scores, though still higher than 2016, as illustrated in the below graph.

Figure 1: Overall quality of the Libraries' service.
Academic staff (n = 181) are more satisfied than students in all three measures of satisfaction. Undergraduates (n = 2,768) and postgraduates (n = 1,762) are equally satisfied, with undergraduates slightly more satisfied with their treatment by the Libraries.
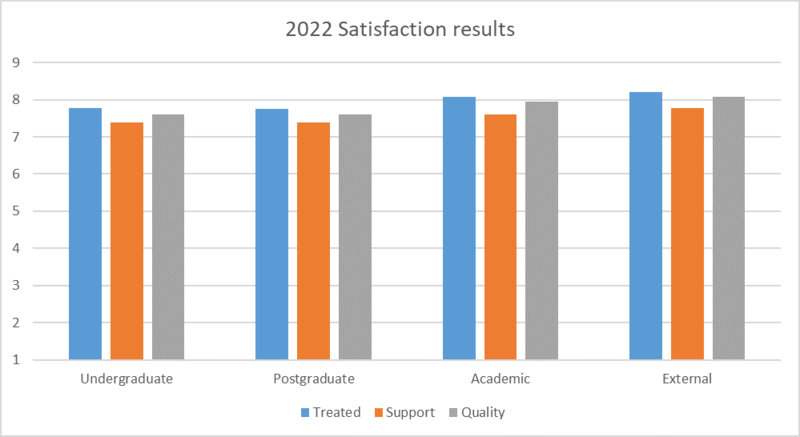
Figure 2: Reader satisfaction results for 2022
External readers (n = 74) are more satisfied than Oxford University members in all three measures of satisfaction.
Reader expectations and priorities
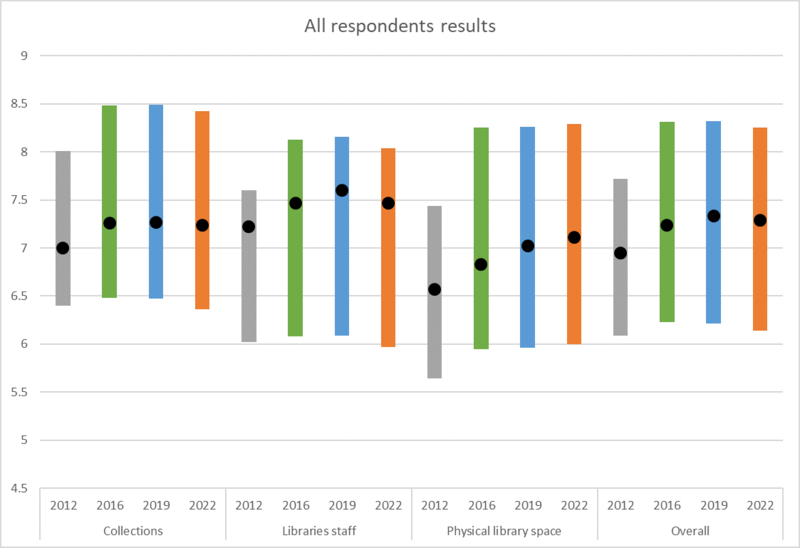
Figure 3: All respondents' results for 2022
Taking the answers of all respondents, the 2022 results are similar to the 2019 results. There has been a small decrease in respondents' evaluation of the level of customer service by libraries staff (back to 2016 level). There has been a large increase in respondents' evaluation of physical library space. Respondents' evaluation of collections has stayed the same since 2016.
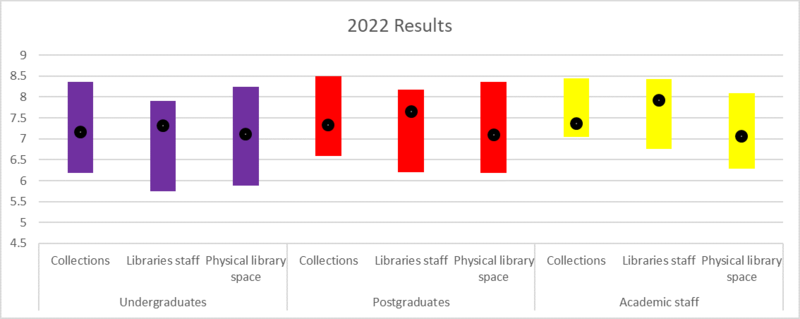
Figure 4: 2022 results by group
Collections are the most important aspect of library services for all three University of Oxford groups. For undergraduates and postgraduates this is followed by physical library spaces, with libraries staff customer service third. For academics, libraries staff customer service is more important than physical library spaces.
There is a consistent perception of our current performance level across all three groups in the areas of physical library space and collection provision and access. Undergraduates report a lower level of performance of libraries staff customer service than postgraduates, who report lower performance than academic staff.
The ‘zone of tolerance’ – the difference between the ideal and lowest acceptable levels of provision (the coloured bars in the above graph) – is broadly the same for all three groups across all three aspects, with undergraduates having the slightly largest and academic staff the slightly smallest in all three areas.
For all three groups, library staff customer service is the best performing aspect of our provision (we are closest to the ideal level – towards the top of the ‘zone of tolerance’). For undergraduates and academic staff, our worst performance is collections: we are close to the lowest acceptable level for academic staff in this aspect. For postgraduates, it is physical library space.
Collections
There were eight questions about collections and access to them, and each respondent was asked three. Everyone was asked, “The electronic resources (e.g. e-journals, e-books, databases) I need”, and the other two questions were randomly selected from the pool.
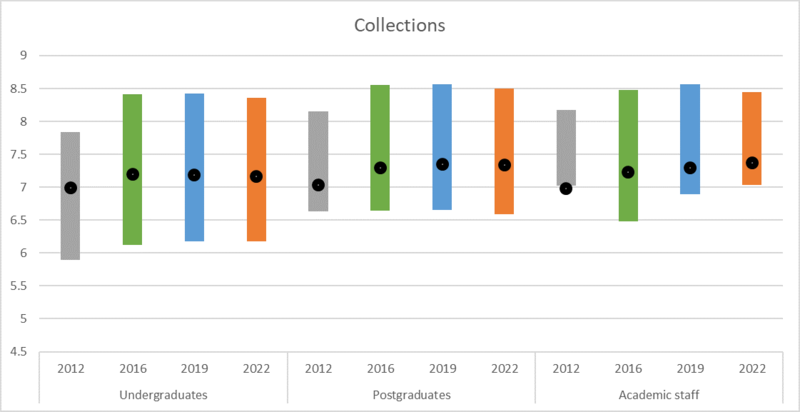
Figure 5: Score by group for collections
Our current performance scores have broadly plateaued since the 2016 survey, with undergraduates giving the lowest score (7.2), followed by postgraduates (7.3) then academic staff (7.4). The ideal scores have dropped slightly across all three groups, and are the same for postgraduates and academic staff (8.5), and only slightly lower for undergraduates (8.4). However, the lowest level academic staff would find acceptable has risen from 6.9 in 2019 to 7.0, and remains the highest of the three groups by some distance.
Libraries staff
There were nine questions about Libraries staff. Each respondent was asked three. Everyone was asked, “Staff who deal with readers in a caring manner”, and the other two questions were randomly selected from the pool.
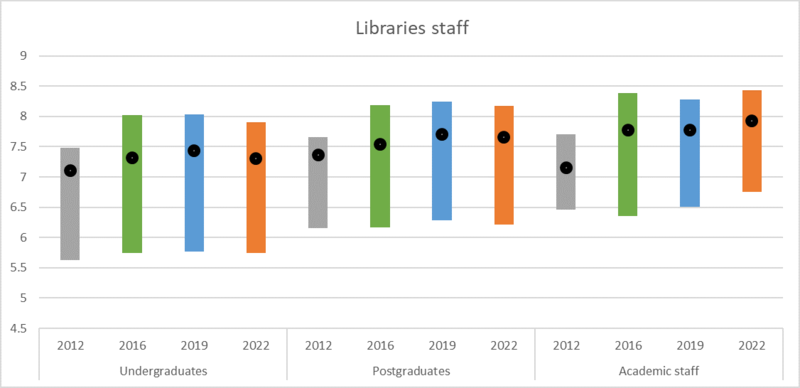
Figure 6: Scores for Libraries staff, 2012–2022
Our current performance level has decreased from the 2019 survey for undergraduates (7.4 to 7.3), is the same for postgraduates (7.7), and has increased for academic staff (7.8 to 7.9). The lowest level academic staff would find acceptable has also increased, from 6.5 to 6.8, as has their ideal score (8.3 to 8.4). The ideal scores and lowest acceptable level for undergraduates and postgraduates have all decreased slightly.
Physical library use
The library used most often by respondents was their college library (38%), followed by Bodleian Library: Radcliffe Camera (13.9%), Bodleian Library: Old Bodleian and Gladstone Link (12.7%), and Social Science Library (5.6%). 176 respondents (3.7%) stated that they do not use a physical library.
There were five questions about physical library spaces. Each respondent was asked two. Everyone was asked, “Library space that inspires study and learning”, and the other question was randomly selected from the pool. Respondents were asked to answer in respect of the library they used most often. Those who do not use a physical library could answer ‘Not applicable’ (they were unable to do this in 2012, hence the very low scores from academic staff that year).
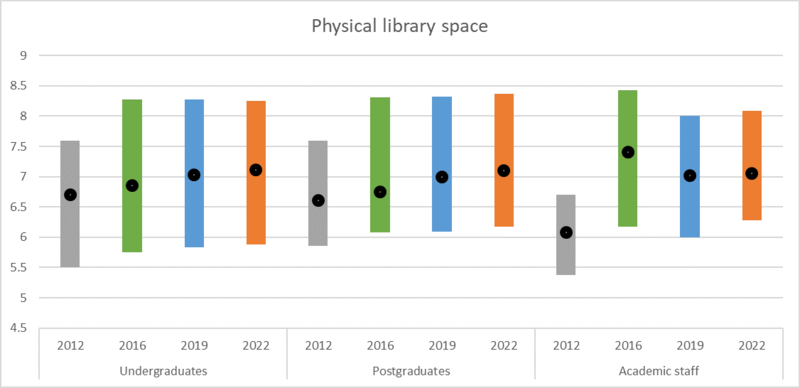
Figure 7: Scores for physical library space
All three groups are consistent in their assessment of how well we meet their needs for physical library spaces, giving us a score of 7.1, up from 7.0 across the board in 2019. They differ in their ‘zone of tolerance’. Undergraduates have the largest: between 5.9 and 8.3. Postgraduates have a higher minimum (6.2) and slightly higher ideal level (8.4) than undergraduates. Academic staff have a slightly higher minimum than postgraduates (6.3), but a much lower ideal level (8.1), and so the smallest ‘zone of tolerance’. This is the only aspect of library provision where academic staff have the smallest ‘zone of tolerance’ because the ideal level is lower – in all others it is because the minimum tolerable level is higher.
Information skills outcomes
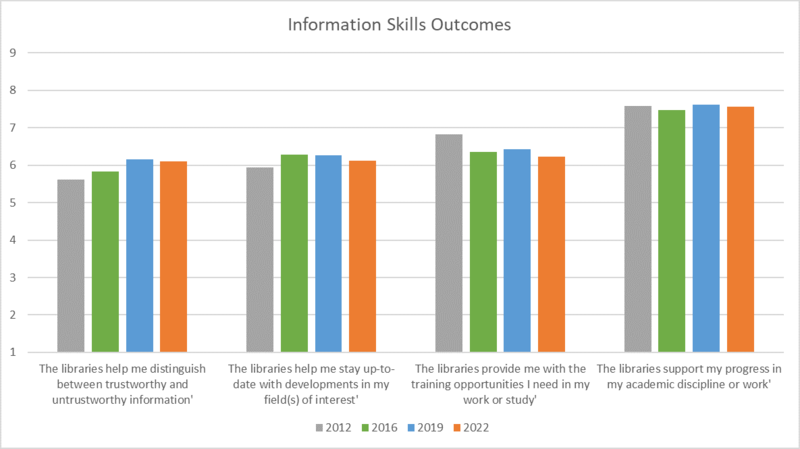
Figure 8: Scores for information skills outcomes
For students, all scores for information skills outcomes have decreased slightly since 2019.
Free-text comments
There were 2,689 comments from 1,637 respondents.
As is expected of such a survey, the majority of comments were negative. However, 25% of the comments were positive about library services in the collegiate university.
The vast majority of negative comments (46%) were about physical libraries, with half commenting on the poor Wi-Fi and 40% on uncomfortable study environment. Access to resources also received a high number (327) of negative comments – primarily relating to opening hours and borrowing policies – as did the contents of our collections (249). Other issues were COVID-19 response, communication, the Collegiate library system, resource discovery (SOLO), support services, and staff.
The positive comments were roughly equally split between staff (136), general love for the libraries (105), contents of our collections (86), physical libraries (82), the collegiate library system (72) and access to resources – notably Scan & Deliver (40).
Wi-Fi
465 of the comments negatively mentioned Wi-Fi. Most comments relate to the Radcliffe Camera and Old Library, but there were also numerous comments about the poor Wi-Fi in the Vere Harmsworth Library, Taylor Institution Library, Social Science Library, English Faculty Library and Law Library.
Our investigations identified three issues that combine to give this poor experience:
- The login to the Bodleian Wi-Fi was not working.
- The Wi-Fi signal cannot pass through the thick stone wall of historic buildings.
- There is not sufficient capacity on the routers, particularly when people are streaming online content.
Comfort of study spaces
There were 372 negative comments about the comfort of the physical study spaces in libraries, comprising:
- uncomfortable and un-ergonomic furniture
- lack of variety of furniture
- poor temperature control
- poor lighting
- inconvenient and unpleasant toilets
- lack of access to drinking water
- lack of space to take a break within the building where refreshments brought from home can be consumed
Opening hours
There were 147 negative comments about opening hours, roughly equally split between a desire for longer weekend hours, earlier mornings (before 9am), later evenings, and generally “longer hours”. 49% of these negative comments came from postgraduates and 39% came from undergraduates.
Borrowing policies
There were 117 negative comments expressing dissatisfaction with the prevalence of non-loan books, the short loan periods, the inconsistency of borrowing policies across Bodleian Libraries, and the lack of automatic renewals.
Contents of collections
Half of the negative comments about the contents of our collections referred to the lack of ebooks that could be used easily at home – whether due to no electronic copy being in our collection, or only an electronic legal deposit version.
Almost 60 comments mentioned lack of access to resources. Some of these resources we do have, but they are difficult to find or there are access issues. Some of the resources have been added to our wishlists. Most of these comments were too generic to enable them to be addressed.
Communication
A large number of negative comments related, inaccurately, to lack of specific provision. This is a communication issue. There is also a clear desire for physical library inductions.
There were 37 negative comments about moving opening of the libraries from 9am to 9.30am due to the Omicron variant of COVID-19. This was reversed when the University BCP level was reduced, but some of the comments were received after this point. There was a lack of awareness about why we had made this change to later opening – all those who commented thought it was a general change to opening hours; none of them related it to COVID measures.
COVID protocols
There were 115 comments about COVID protocols, with a mixture of viewpoints, some strongly expressed.


